Computerized Precision Pendulum
Randall D. Peters1 and Eric Daine2
1Physics Department, and 2 School of Engineering, Mercer
University, Macon, GA.
Copyright May 2012
Abstract
A precision pendulum with two fixed axes, each having a period close to 1
s, has been outfitted with a small fully differential electronics package
using a capacitive sensor. Power is received through the USB cable of the
computer, which operates with a 24-bit analog to digital converter sampling
the pendulum's motion at a frequency near 50 Hz. A user friendly software
package provides real-time graphical display of the pendulum's free decay.
Records stored in computer memory are available for later detailed investigation
by a variety of analytic means.
Background
The heart of the instrument used for this study is the Kater pendulum sold
commercially by Tel-Atomic Inc. [1], and which was described in a ``Physics
Teacher'' article [2]. Apart from a research-oriented activity [3], it has
only been previously monitored with timers used to measure its period.
Typically the earth's gravitational field is measured with a pendulum using
only a stopwatch (manually) or a period counter (electronically). Although
the latter is more accurate than the former, both methods are primitive as
compared to the results that can be achieved with a sensor that monitors
full motion of the pendulum [4]. Such a sensor was used for the study [3];
however, the electronics employed for that work is of a type that is no longer
commercially available. The NE5521n chip that was the key component used
in conjunction with the fully differential capacitive sensor [5] ceased to
be readily available after a factory fire. Fortunately, not long afterwards,
Analog Devices marketed its capacitance to digital converter (AD7745), which
is used in the sensor package of the present work. It is also employed in
the computerized Cavendish balance [6], another instrument that was designed
by the first author of the present article. Its use of two capacitive sensors
to monitor boom motion allows for a `mechanical common mode rejection' that
makes it more user-friendly than traditional Cavendish experiments based
on optical sensing.
Instrument
Shown in Fig. 1 is a photograph of the brass bar pendulum.

Figure 1. Rotation axes are provided by hanging the bar on a `knife
edge' that is visible in Fig. 2. For `end axis' oscillation, the hole close
to the end of the bar is used. For `mid axis' oscillation, the other hole
is employed. The bar was computer-designed to yield an approximate 1 s period
for each of the two axes.
Figure 2 shows the pendulum configured to swing about the end-axis.
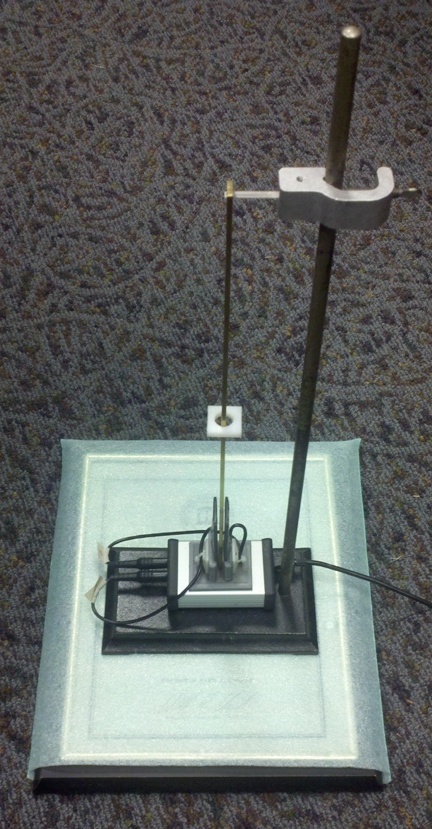
Figure 2. Seen mounted on the pendulum is a small square nylon mass
whose position on the pendulum is adjustable. This sliding mass is used in
the method for estimating `little g' most accurately, and which is described
later in detail, in the context of some representative data.
Estimates of g (approx 9.8 m/s2) require that data be collected
using both axes. For operation about the mid axis, the clamp seen near the
top of the Fig. 2 picture would be repositioned on the vertical steel rod.
It would be a lower clamped position for which the end hole is made to swing
along an arc that is below the position of the active elements of the capacitive
sensor electrodes. The electrodes are not visible, since their pc boards
have been wrapped with heat shrinkable plastic to avoid any shorting of the
electronics that might happen if the brass pendulum should come into contact
with them through misalignment. The whole electronics package is pictured
in more detail in Fig. 3.
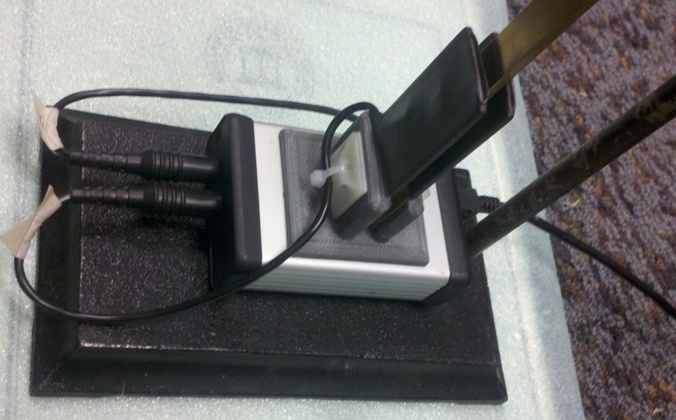
Figure 3. Closeup photograph of the electronics. The top clamp is
positioned for a clearance of about half a cm between the bar end and the
bottom plastic piece sitting on top of the aluminum box that houses the
electronics.
Representative data obtainable with the pendulum
The package is readily configured to operate with any of the most common
computer systems, whether Windows or Linux software, and hardware that is
either 32-bit or 64-bit. Data of the present article were obtained with an
XP laptop operating with a 32-bit cpu.
Shown in Fig. 4 are some long-term free-decays involving oscillation about
both axes.
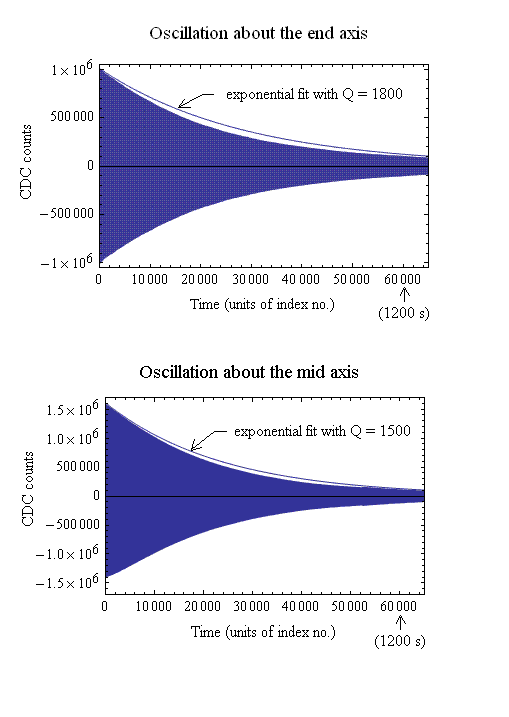
Figure 4. Free-decays showing exponential fits to the positive turning
points. The fits were computed with Excel, but the total number of points
at 60,000 is too large for graphing with Excel. The graphs were generated
using Mathematica.
To obtain a given free decay the pendulum was set into motion manually, by
pushing on the bar with a finger resting on top of the sensor electrodes.
It is seen from Fig. 4 that energy dissipation of the pendulum is more
complicated than simple viscous damping. The Reynolds number is initially
large enough for air drag to involve a quadratic term in the velocity. Thus,
except at the start and end points, it causes the record to dip below the
exponential. The deviation is seen to be greater for end axis oscillation
than for mid axis oscillation. The quality factors also differ, being larger
at 1800 for the former and 1500 for the latter. These numbers are only
approximate, since Q is amplitude dependent except for viscous damping [7].
Textbooks routinely give the impression that a damping correction must be
generally applied to an estimate for the period of a mechanical oscillator.
In other words, when the equation of motion is of the form
|
..
x
|
+ 2 b |
.
x
|
+ w02 x
= 0 |
|
(1) |
involving a viscous (linear) damping parameter b,
the period of oscillation is given by
| T =
2p/w ,
w =
[w02-b2]1/2 , b =
w0/(2Q) |
|
(2) |
It is difficult to experimentally verify the damping redshift predicted
theoretically by this equation. As seen from the following log-log graph,
it amounts to less than one part in 10 million for the present experiments,
where Q > 1000.
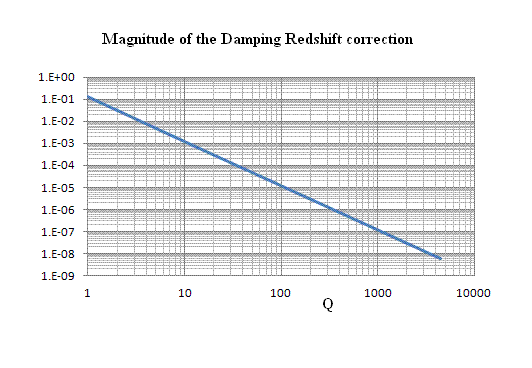
Figure 5. Fractional value of the damping
redshift|(f - f0)/f0| plotted as a function
of the quality factor.
For efforts to estimate the earth's field to one part in ten thousand, there
is clearly no need to worry about the complications of Eq.(2).
Measurement Technique
As with the technique used in ref. 4, we here choose to work with Lissajous
figures, and two examples are provided in Fig. 6.
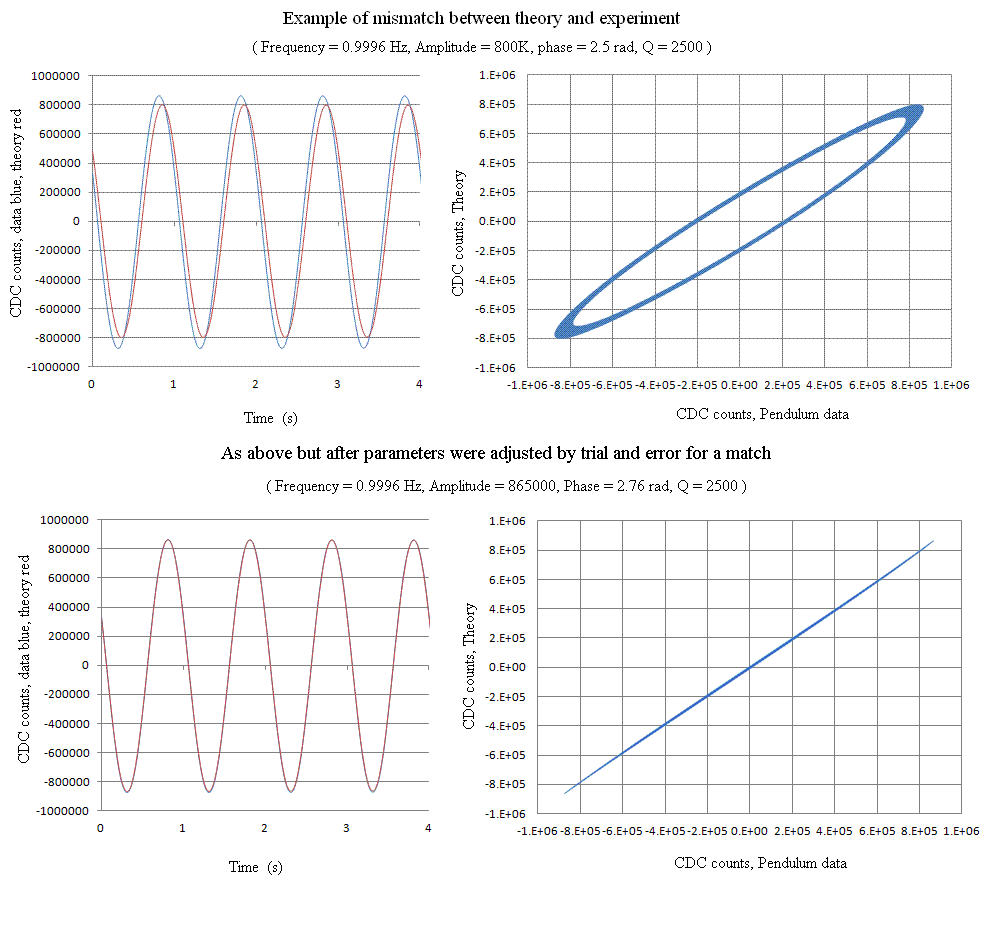
Figure 6. Illustration of the method used to obtain a theoretical
fit to the data. Only 4 seconds are shown in the time plots, of the 88 s
total time recorded. All 4400 points were included in the generation of the
Lissajous figures.
The frequency measurement is determined by the sample rate of the electronics,
which was measured to be 49.93 Hz. Although this number of acquired samples
per second is somewhat variable and temperature dependent, a change of about
50 Celsius degrees is required for an increase in the frequency of one part
per thousand. Based on the authors' experience with the package, it is expected
that the oscillator in the electronics that is responsible for this sample
rate should be stable to a few parts per ten thousand for the typical laboratory
environment.
For accurate estimates of g the frequency needs to be checked carefully the
first time and maybe periodically thereafter. It is readily done using a
quartz-based stopwatch or by comparison with the NIST standard wwv. An equivalent
to the latter (radio broadcast signal) can be monitored via the internet.
By comparing the two for a total time of 5 to 10 minutes, the sample rate
can be measured to a part per ten thosand; the objective sought in estimates
of the earth's field when measured with this Kater pendulum.
The beauty of the Kater method is the following. If the periods about the
two axes can be matched, then the instrument is equivalent to a simple pendulum
whose length equals the distance between the axes; which for the Tel-Atomic
unit is 0.2481 m. If they are `slightly' different, then the following equation
can be used to estimate g in m/s2 typically to a few parts per
thousand:
| g =
4 p2 × 0.2481 × |
Tmid
Tend3
|
|
|
(3) |
To thus use Eq.(3) the mid axis oscillation that was recorded yielded the
graphs of Fig. 7.
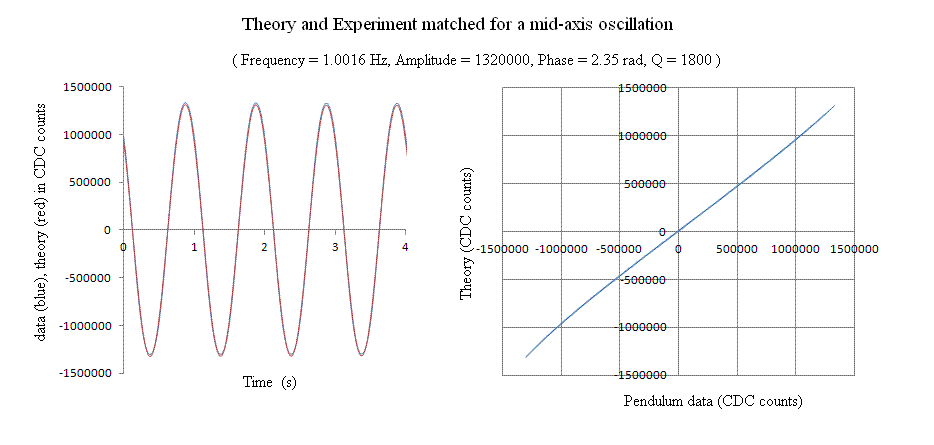
Figure 7. As with the bottom set of Fig. 6 but oscillating about the
mid axis. The estimated frequency for this case (based on the theoretical
parameter yielding a match) was 1.0016 Hz.
Based on the frequencies indicated in Figures 6 and 7, one obtains from Eq.(3)
an estimate of g = 9.77 m/s2. We will see from
the data presented later, obtained with a small mass slider whose position
on the bar is adjustable-that for differences as small as typically encountered
with the Tel-Atomic Kater pendulum-a better estimate for g is possible. It
is obtained by using g =
4 pi2 L (Tmid/Tend3 + 1/ Tmean2)/2,
where L = 0.2481 m and Tmean =
(Tend + Tmid)/2. For the values indicated
in Figures 6 and 7, this yields g = 9.787 m/s2;
which differs by one part per thousand from the value of 9.797 that was obtained
in a previous careful measurement of the earth's field in Macon, Ga [2].
Use of the sliding mass
As described in [2], the most accurate means for estimating g is to measure
the period of each of the two axes as a function of the position of the slider
that is pictured in Fig. 1. By means of a center punch during fabrication,
a set of 35 small-point indentations span the brass bar through nearly its
entire length. Beginning farthest from the end axis, these markers spaced
in 1 cm intervals would number 36, except that the mid axis hole disallows
the use of marker number 13.
For the present work, slider positions 8 through 17 were employed, yielding
the graph shown in Fig. 8.
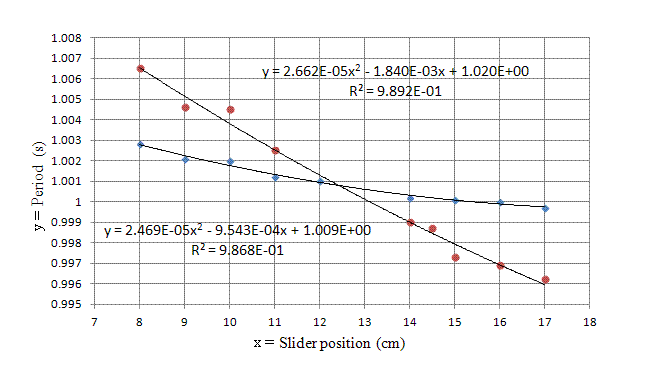
Figure 8. Data used in estimating g with the highest accuracy. End
axis periods are represented by the blue diamonds and mid axis periods by
the red circles.
Each of the 18 period measurements performed for the generation of this figure
used a Lissajous figure generated by Excel, in which the pendulum was monitored
for a total decay time of 10 s. Using the quadratic trendline fit expressions
indicated in Fig. 8, Excel was used to find the period corresponding to the
intersection of the two curves. This period of 1.0007 s yields an estimate
for g of 9.801 m/s2, which differs from the Macon `standard'
by 5 parts per ten thousand. It is expected that the difference would become
smaller as more points should be used in the generation of Fig. 8.
Precision of the Lissajous measurement
As demonstrated in Fig. 9, the Lissajous technique is amenable to a parts
per ten thousand match of a theoretical fit to a record whose total length
is 10 s.
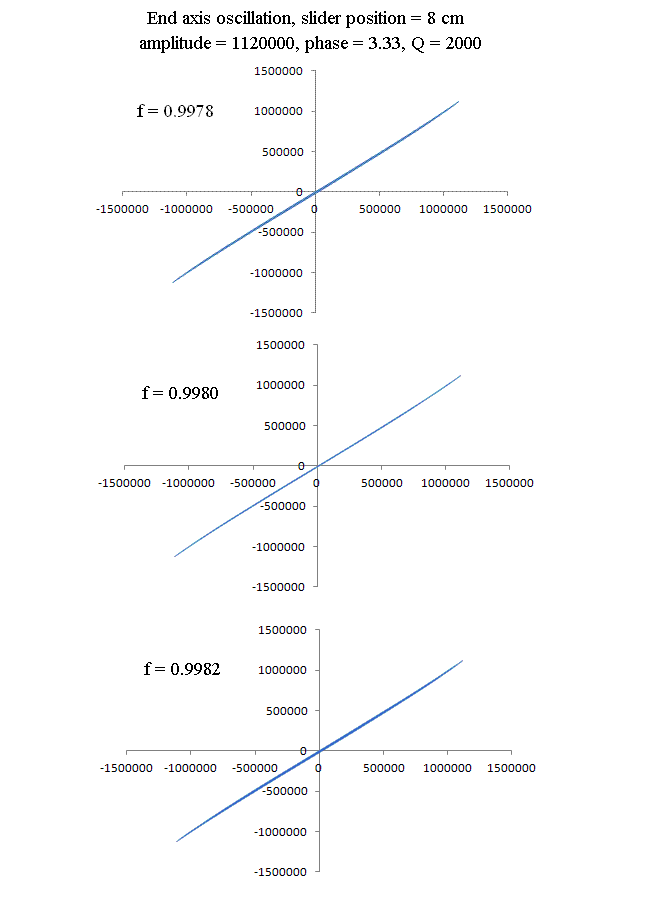
Figure 9. Representative example to illustration sensitivity to choice
for the theoretical value of pendulum frequency. Record length in all three
cases was the same 10 s, and all the indicated fit parameters were held constant
except for the frequency,.
It can be seen from Fig. 9 that `thickening' of the Lissajous `line' becomes
detectable if the frequency deviates from the best fit value by more than
two parts per ten thousand.
Use of Excel to generate the Lissajous figures
Excel can be readily configured with a template to rapidly generate the Lissajous
figures. Parameter adjustments by trial and error, that influence the graph
almost instantaneously, are configured for updates using `absolute' referencing.
A given raw data set is input to the template by means of paste operations
using hot keys. Selection of the Q is of least importance, followed by choice
of the amplitude parameter. These are selected most readily by also graphing
a time display of theory and experiment on the same plot. A rough setting
of phase and frequency are then also performed using the time plot. Once
a reasonably narrow line has been realized for the Lissajous curve, it is
then the only graph considered in the final selection for values of the phase
and frequency parameters. The technique used is similar to that of finding
the root of a function by jumping back and forth either side of the solution,
with ever smaller deviations from one choice to the next.
As noted earlier, the `best' estimate for a rapid determination of g, using
the Tel-Atomic Kater pendulum, is evidently the one which uses an average
involving (i) Eq. (8), and (ii) the mean value of the periods obtained from
the mid and end axes. The evidence for this claim is found in Fig. 10.
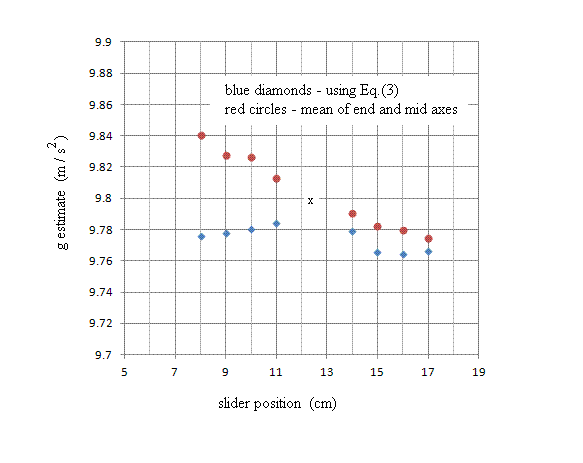
Figure 10. Comparison of g estimates based on two different methods,
with calculations using the same period values as the data graphed in Fig.
8. An x has been placed at the position corresponding to identical periods
of end axis and mid axix.
Over the full range of slider position from 8 to 17 cm, the method of Eq.(3)
is seen (in a global average sense) to provide a generally better estimate
for g than the method which works simply with the mean period of the two
axes. For a Kater pendulum with nearly matched periods the simple mean method
evidently gives comparable accuracy to the method using Eq.(3). Because of
the cusp in the plot of the latter, it is seen that the best approach is
to use the avereage of the two methods.
Noise level of the electronics
Because of the fully differential electronics, and the 24 bit adc electronics
package (21 bits employed in record saves), the signal to noise ratio of
measurements performed with this instrument is remarkably great. Its magnitude
is readily appreciated by comparing Fig. (7) with the next Fig. (11), which
was obtained after placing the pendulum on the pier of the seismic station
in the Mercer Physics department.
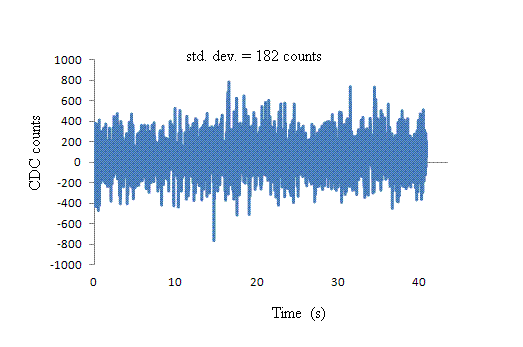
Figure 11. Electronics noise measured by placing the pendulum on a
seismic pier and providing a cover to eliminate air current disturbances.
For a max-amplitude value of 1,300,000 CDC counts and a noise floor of 182
CDC counts, we find an operational SNR > 7000.
Sensor Linearity
It is also noteworthy that the linearity of the sensor is excellent, as can
be seen from Fig. 12.
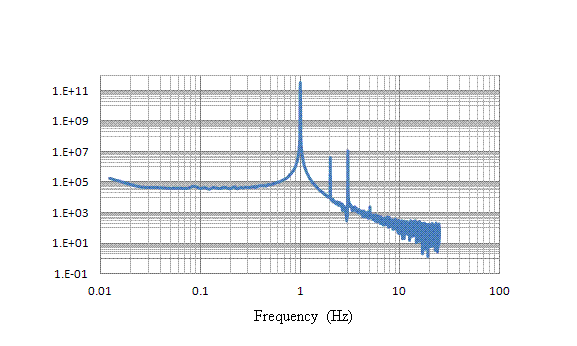
Figure 12. 4096-point FFT spectrum of an 88 s duration record obtained
using end axis oscillation. The amplitude of the motion was 865,000 CDC counts.
The pendulum's natural frequency is seen as the prominent spectral line at
1 Hz, and two of its harmonics are visible in the log-log plot. Harmonic
distortion is very low at -49 dB for the 2nd harmonic and -45 dB for the
3rd harmonic.
References
[1] described online
at
http://telatomic.com/mechanics/kater_pendulum.html
[2] R. D. Peters, ``Student-friendly precison pendulum'', The Physics Teacher,
37, Issue 7, p. 390 (1999).
[3] R. D. Peters, ``Study of simple harmonic oscillator resonance using a
compact Kater pendulum'', online at
http://physics.mercer.edu/hpage/kater-res.html
[4] R. D. Peters, ``Automated Kater Pendulum'', Eur. J. Phys. 18 (1997) 217-221.
Online at
http://iopscience.iop.org/0143-0807/18/3/016/pdf/0143-0807_18_3_016.pdf
[5]``Symmetric differential capacitance transducer employing cross coupled
conductive plates to form equipotential pairs'', U. S. Patent 5,461,319.
The predecessor LRDC sensor, also invented by Peters, was the first version
of ``fully differential capacitive sensors'', which are becoming increasingly
commonplace in engineering applications.
[6] described online
at
http://telatomic.com/mechanics/cavendish_balance.html
[7] The amplitude dependence of Q for nonlinear damping is treated on page
20-52 of:
R. D. Peters, ``Damping Theory'', Vibration and Shock Handbook, CRC
Press, ed. Clarence W. de Silva (2005). The same material is also available
in Ch. 2 of Vibration Damping, Control and Design, CRC Press, (2007).
File translated from TEX by
TTH,
version 1.95.
On 3 May 2012, 17:49.


